

What is Observability?
Observability is used to observe the internal states of the application through metrics, logs, and traces and gives insight into the functioning of the application. It makes the application more transparent and easier to monitor, troubleshoot, and manage.
Steps to implement Observability in Spring Boot 3.0
Spring Boot observability can be easily used to monitor the application internal states. We can easily monitor the performance of our service classes, the performance of the methods, etc. In this example, we simply observe the execution time of a method in our application.
Step 1- Adding dependencies
We will be using the spring actuator and spring aop dependencies.
<dependencies>
    <dependency>
    			<groupId>org.springframework.boot</groupId>
    			<artifactId>spring-boot-starter-actuator</artifactId>
    </dependency>

    <dependency>
    			<groupId>org.springframework.boot</groupId>
    			<artifactId>spring-boot-starter-aop</artifactId>
    </dependency>
</dependencies>
Once we have added the required dependencies, we will need to enable the actuator endpoints. For this, we will be adding the following configuration in our application.properties or application.yml file.
management:
  endpoints:
    web:
      exposure:
        include: '*'
  endpoint:
    health:
      show-details: always
Step 2- Implements ObservationHandler
ObservationHandler is an interface that provides the implementation of Observation.Context means we can override its default methods and observe the various context (methods, class, event, scope etc.) of the application. The ObservationHandler interface provides the following methods:
- onStart(T context)
- onError(T context)
- onEvent(Observation.Event event, T context)
- onScopeOpened(T context)
- onScopeClosed(T context)
- onScopeReset(T context)
- onStop(T context)
- supportsContext(Observation.Context context)
For more details about the ObservationHandler methods, please refer to the to the Spring Official documentation.
We will create our custom PerformanceTracker class and implement the ObservationHandler interface. We will track the execution time of a method. For this, we will be adding definitions to the onStart() and onStop() methods.
import io.micrometer.observation.Observation;
import io.micrometer.observation.Observation.Context;
import io.micrometer.observation.ObservationHandler;
import lombok.extern.slf4j.Slf4j;

@Slf4j
public class PerformanceHandler implements ObservationHandler<Observation.Context> {

	public void onStart(Observation.Context context) {

		log.info("Method exection started {}", context.getName());
		// adding current time of the system in the key "time"
		context.put("time", System.currentTimeMillis());

    }

	public void onStop(Observation.Context context) {

		log.info("Method exection ended {}", context.getName());
		// calculating the time duration, current time of system - start time (gets using the key "time")
		log.info("total duration {}", System.currentTimeMillis() - context.getOrDefault("time", 0L));

    }

	@Override
	public boolean supportsContext(Context context) {
		return true;
	}

}
Step 3- Observation Registry
Now, we have our own custom PerformanceHandler class. But how will the Spring Observability know about our handler class or how it calls onStart() or onStop() methods? For this, we need to register our handler class in the observation registry. We can register our PerformanceHandler class to ObservationRegistry using the bean of ObservedAspect.
Below, we have created a new class ObservationAspectConfig and annotated it with @Configuration annotation so that the spring will know this class will return some beans. We have created the ObservedAspect bean and passed the object of our custom PerformanceHandle class to it. So that, it will register our PerformanceHandle class to the ObservedAspect bean.
import org.springframework.context.annotation.Bean;
import org.springframework.context.annotation.Configuration;

import io.micrometer.observation.ObservationRegistry;
import io.micrometer.observation.aop.ObservedAspect;

@Configuration
public class ObservationAspectConfig {

	@Bean
	public ObservedAspect observedAspect(ObservationRegistry registry) {
		// In the observationHandler we pass the object of our PerfromanceHandle class
		registry.observationConfig().observationHandler(new PerformanceHandler());
		return new ObservedAspect(registry);
	}
}
Step 4- Observing using Spring Observability
In this step, we will observe the execution time of a method of our service class. We use @Observed annotation for observing or tracking the execution time.
@Service
public class TaskServiceImpl implements TaskService {

  	//auto-wiring TaskRepository to perform persistence operations
  	@Autowired
  	private TaskRepository taskRepository;

  	@Override
  	// using @Observed annotation,
  	// we will track the time taken by this method to complete its exection.
  	@Observed(name = "create.Task")
  	public Task createTask(Task task) {
  		Task taskSavedToDB = this.taskRepository.save(task);
  		return taskSavedToDB;
  	}
	}
Above, we have annotated the createTask() method with the @Observed(name = “create.Task”) annotation; this annotation will make sure to observe this method using the overridden methods of the ObservationHandler interface. The “name” parameter is used as a metric; we can create our own custom metrics for observing multiple methods.
Step 5- Testing
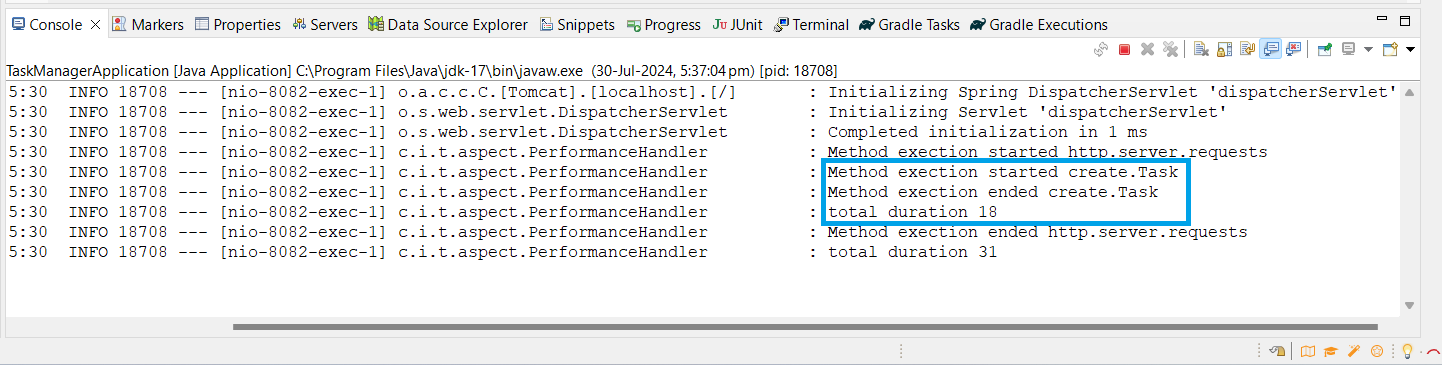
Now, whenever someone hits the API request for this createTask() method, our Observability will track the complete execution time of this method.
We can also visualize it using the spring boot actuators as follows:

We can also get a detailed analysis of our custom metric that we have added in the @Observed annotation.
