Monitoring microservices means tracking the health, performance, and behavior of your services to ensure they run efficiently and reliably. It’s essential for both microservices and standalone applications, because a failure in one service can impact others, and debugging such issues can be time-consuming—ultimately leading to business losses.
In this tutorial, you’ll learn how to monitor a Spring Boot application or microservice using the Micrometer monitoring library.
Commonly used Microservices Monitoring Tools
| Tools | Purpose |
| Prometheus | Metric collection (e.g., CUP, memory, custom application metrics) |
| Grafana | Dashboard and Visualization |
| ELK Stack | Centralized logging (Elasticsearch, Logstack, Kibana) |
| Zipkin | Distributed tracing |
| Kibana | Log analysis |
| Alertmanager | Send alerts when metrics cross thresholds |
What is Micrometer

Micrometer is a metrics instrumentation library for Java applications, especially those using Spring Boot. It provides a simple facade to integrate actuator metrics with external monitoring systems and allows us to instrument JVM-based applications. It provides a unified API to collect, record and export metrics from your application to various monitoring systems such as Prometheus, Grafana, Datadog, Graphite, InfluxDB, Cloudwatch (AWS) etc.
What is Prometheus

Prometheus is an open-source monitoring and alerting toolkit designed to collect, store, and query metrics from systems, applications, and microservices. It supports metrics like CPU usage, memory consumption, and HTTP request counts.
Originally developed by SoundCloud, Prometheus has become a core part of modern cloud-native monitoring. It works by pulling metrics from targets over HTTP at regular intervals and storing them in a time-series database for real-time analysis.
Key Components of Prometheus:
- Data Scraper (Prometheus Server): Periodically scrapes metrics data from configured targets over HTTP.
- Time-Series Database: Stores all collected metrics efficiently for querying and visualization.
- User Interface & PromQL: A built-in web UI to explore metrics and write PromQL (Prometheus Query Language) queries.
What is Grafana

Grafana is an open-source dashboarding and data visualization tool that pulls data from various data sources such as Prometheus, Elasticsearch, Graphite, and InfluxDB. It enables you to visualize time-series data in real-time and build custom dashboards for system monitoring, performance tracking, and alerting.
Grafana also allows you to set alert rules based on metrics, and whenever an alert changes its state, it can notify you through channels like email, Slack, or webhooks.
How to monitor Microservices with Prometheus and Grafana
In this tutorial, you’ll learn how to register a Spring Boot application with Prometheus and export application metrics to Grafana using Docker images of Prometheus and Grafana for monitoring and visualization.
Step 1: Create Spring Boot project
First you need to create a Spring Boot project. Please refer to this guide: How How to Create Spring Boot Project using Spring Initializr?
Step 2: Add Dependency in Spring Boot Application
You need to add the required dependencies based on your monitoring requirements.
In this tutorial, we’ll add the following:
- spring-boot-starter-web
- spring-boot-starter-actuator
- micrometer-registry-prometheus
These dependencies enable the application to expose metrics in a format that Prometheus can scrape.
<dependencies>
		<dependency>
			<groupId>org.springframework.boot</groupId>
			<artifactId>spring-boot-starter-actuator</artifactId>
		</dependency>

		<dependency>
			<groupId>org.springframework.boot</groupId>
			<artifactId>spring-boot-starter-web</artifactId>
		</dependency>

		<dependency>
			<groupId>io.micrometer</groupId>
			<artifactId>micrometer-registry-prometheus</artifactId>
			<scope>runtime</scope>
		</dependency>
</dependencies>
Step 3: Enable Actuator endpoints in Spring Boot application
As of Spring Boot 2.x and above, you must explicitly enable Actuator endpoints to access application metrics. To do this, add the following configuration to your application.properties or application.yml file.
#Actuator Configurations
management.endpoints.web.exposure.include=*
management.endpoint.health.show-details=always
The above configuration will enable all Actuator endpoints, including the default /actuator endpoint.
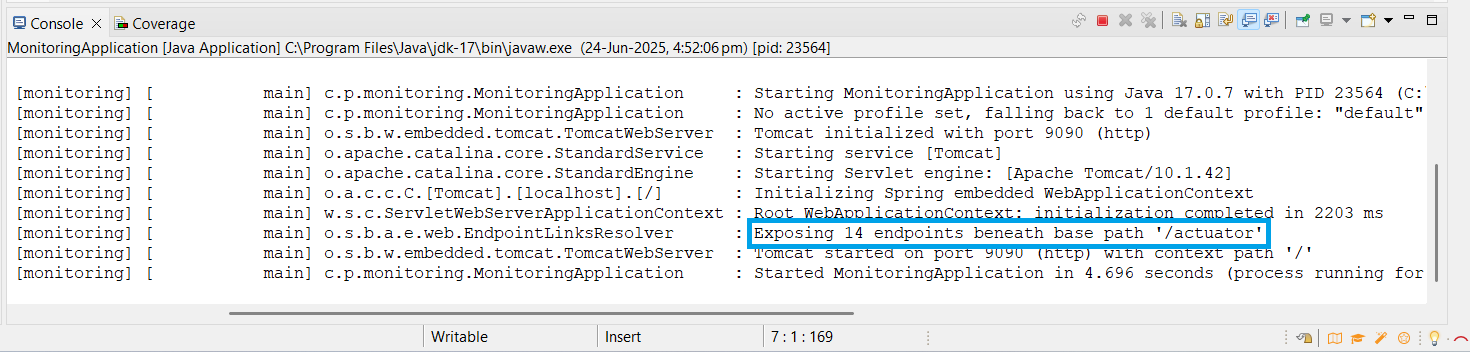
To verify this, start your Spring Boot application and visit http://localhost:PORT_NUMBER/actuator in your browser.
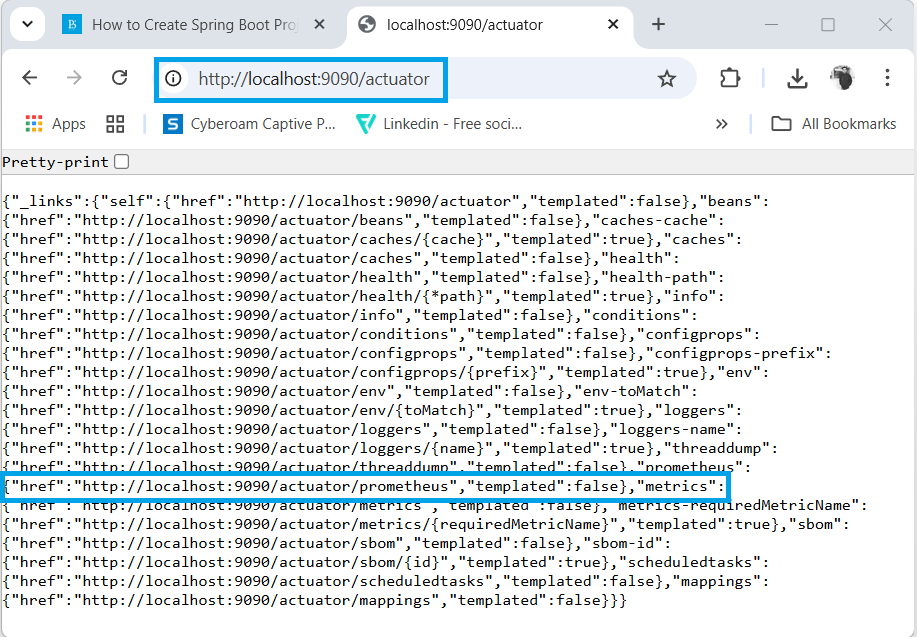
When you access http://localhost:9090/actuator/prometheus, it indicates that Micrometer has successfully integrated the Prometheus registry into your Spring Boot application. This means your app is now exposing Prometheus-compatible metrics, which can be scraped for monitoring and observability.
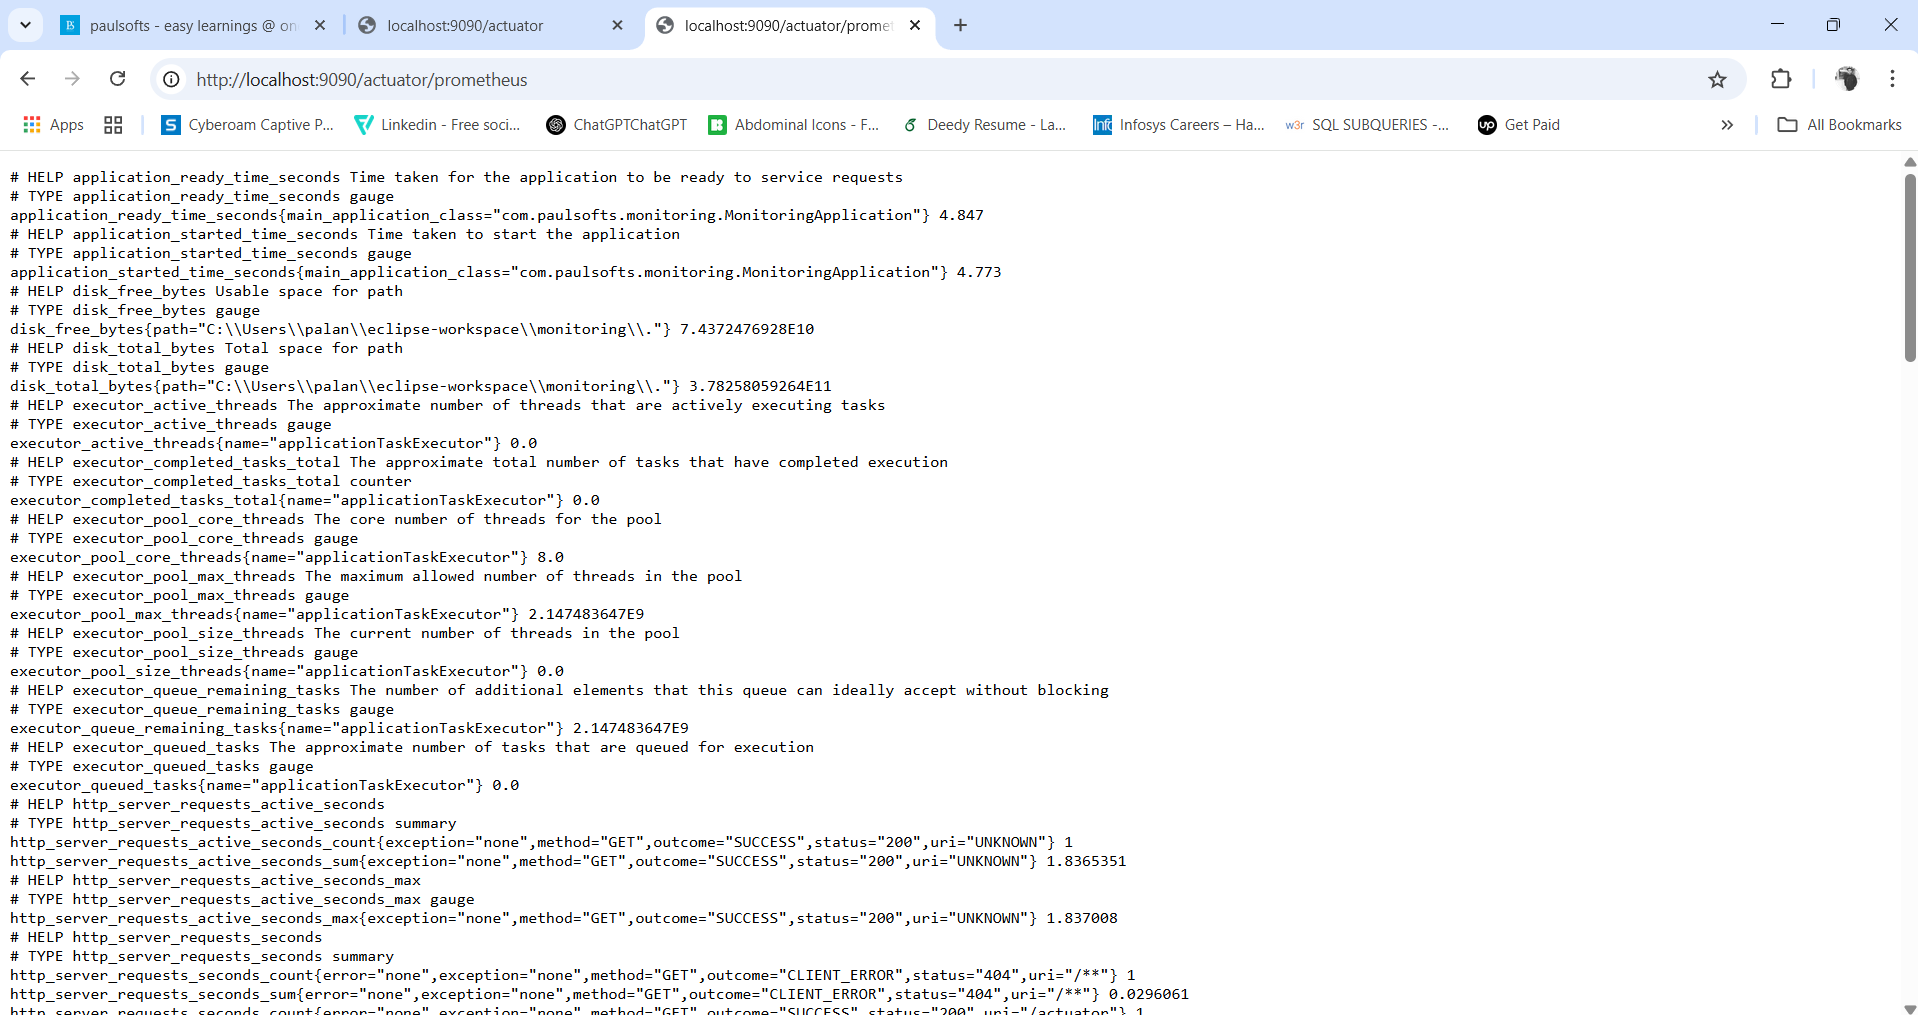
Visualize Spring Boot metrics with Prometheus using Docker
In the above image, you can see the application’s metrics data, which can be collected, represented, and visualized using the Prometheus monitoring system. To achieve this, you need to run a Prometheus server in your environment. In this Prometheus integration tutorial, we’ll demonstrate how to set up and run Prometheus using a Docker image to monitor Spring Boot application metrics effectively.
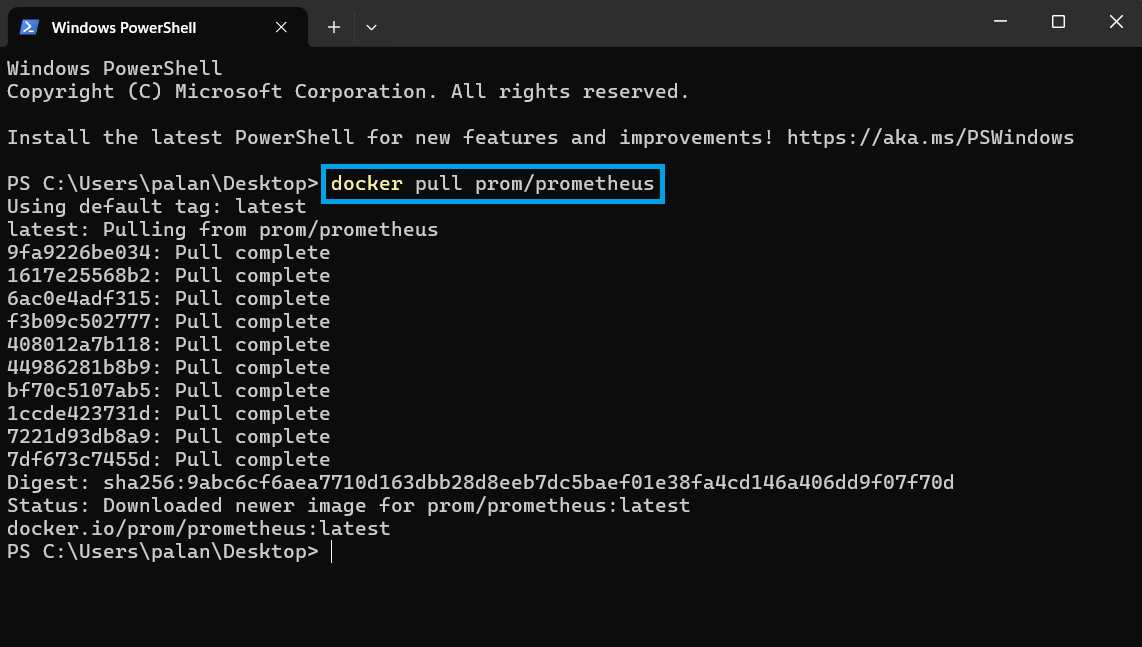
Step 1: How to pull Prometheus docker image from Docker Hub
To set up Prometheus monitoring, you need to pull the official Prometheus Docker image from Docker Hub and run it on your host operating system. Use the following command:
docker pull prom/prometheusThe above command will automatically pull the latest version of the Prometheus monitoring toolkit image from Docker Hub, ensuring you have the most up-to-date features and stability improvements.
The following command allows you to verify whether the Prometheus Docker image has been successfully pulled and is available in your local Docker environment:
docker image lsBelow, you can verify that the Prometheus Docker image is available in your local environment:
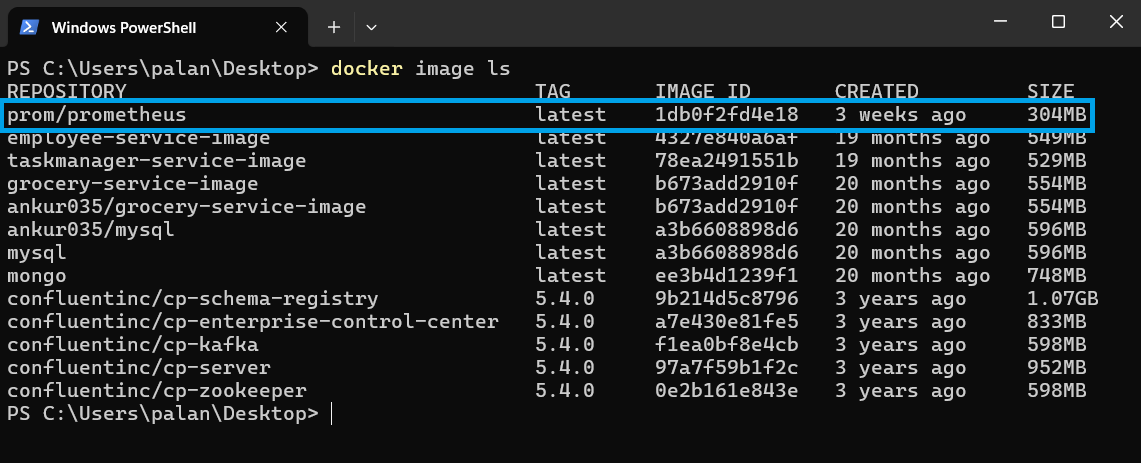
As you can see, Prometheus is available in the environment. To make it work effectively, you need to provide a configuration file that includes all necessary scrape details, such as target endpoints, host IP addresses, and other relevant settings.
Step 2: Prometheus config file (prometheus.yml)
In your project’s resources directory, create a new configuration file named prometheus.yml. It is telling Prometheus how and where to scrape metrics from your Spring Boot application that exposes metrics at actuator/prometheus.
# my global config
global:
  scrape_interval:     15s # Set the scrape interval to every 15 seconds. Default is every 1 minute.
  evaluation_interval: 15s # Evaluate rules every 15 seconds. The default is every 1 minute.
  # scrape_timeout is set to the global default (10s).

# Load rules once and periodically evaluate them according to the global 'evaluation_interval'.
rule_files:
  # - "first_rules.yml"
  # - "second_rules.yml"

# A scrape configuration containing exactly one endpoint to scrape:
# Here it's Prometheus itself.
scrape_configs:
  - job_name: 'monitor-spring-boot-service'
    metrics_path: '/actuator/prometheus'
    scrape_interval: 5s
    static_configs:
- targets: ['host.docker.internal:9090']job_name: It represents the label or name specific targetmetrics_path: '/actuator/prometheus'Prometheus will make a HTTP requests to this path on targetscrape_intervalPrometheus will scrape the target at every 5 secondsstatic_configIt defines the list of static targets (.i.e.,fixed list of addresses to scrape from)targets: ['host.docker.internal:9090']This tells the Prometheus to scrape fromhost.docker.internal:9090. Basically, it allows the docker container to reach the host machine’s localhost (your machine localhost). The9090is the port where your Spring Boot application is running.
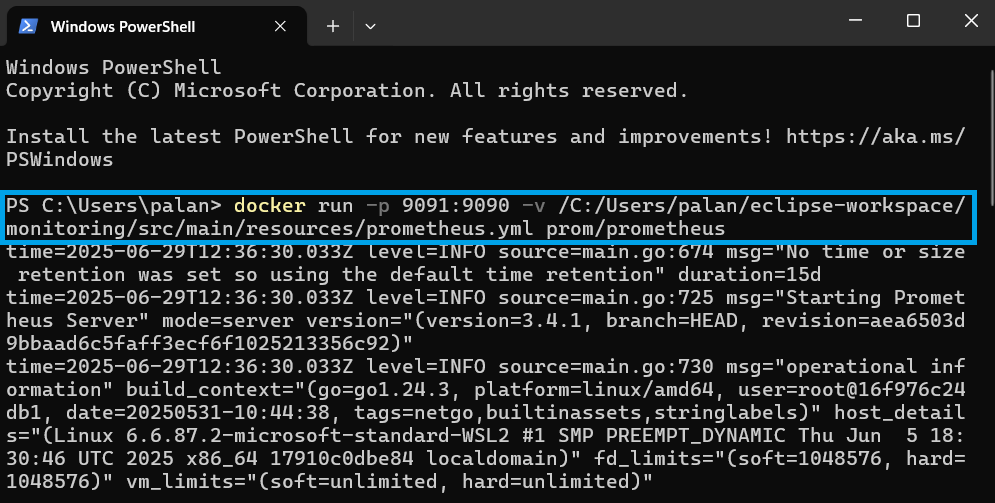
Step 3: How to run Prometheus in Docker
To monitor your Spring Boot or microservices application, you need to run Prometheus in a Docker container with the correct configuration.
docker run -p 9091:9090 -v /C:/Users/palan/eclipse-workspace/monitoring/src/main/resources/prometheus.yml prom/prometheusBy running this command, you start the Prometheus server using Docker, which provides access to the metrics dashboard at http://localhost:9091.
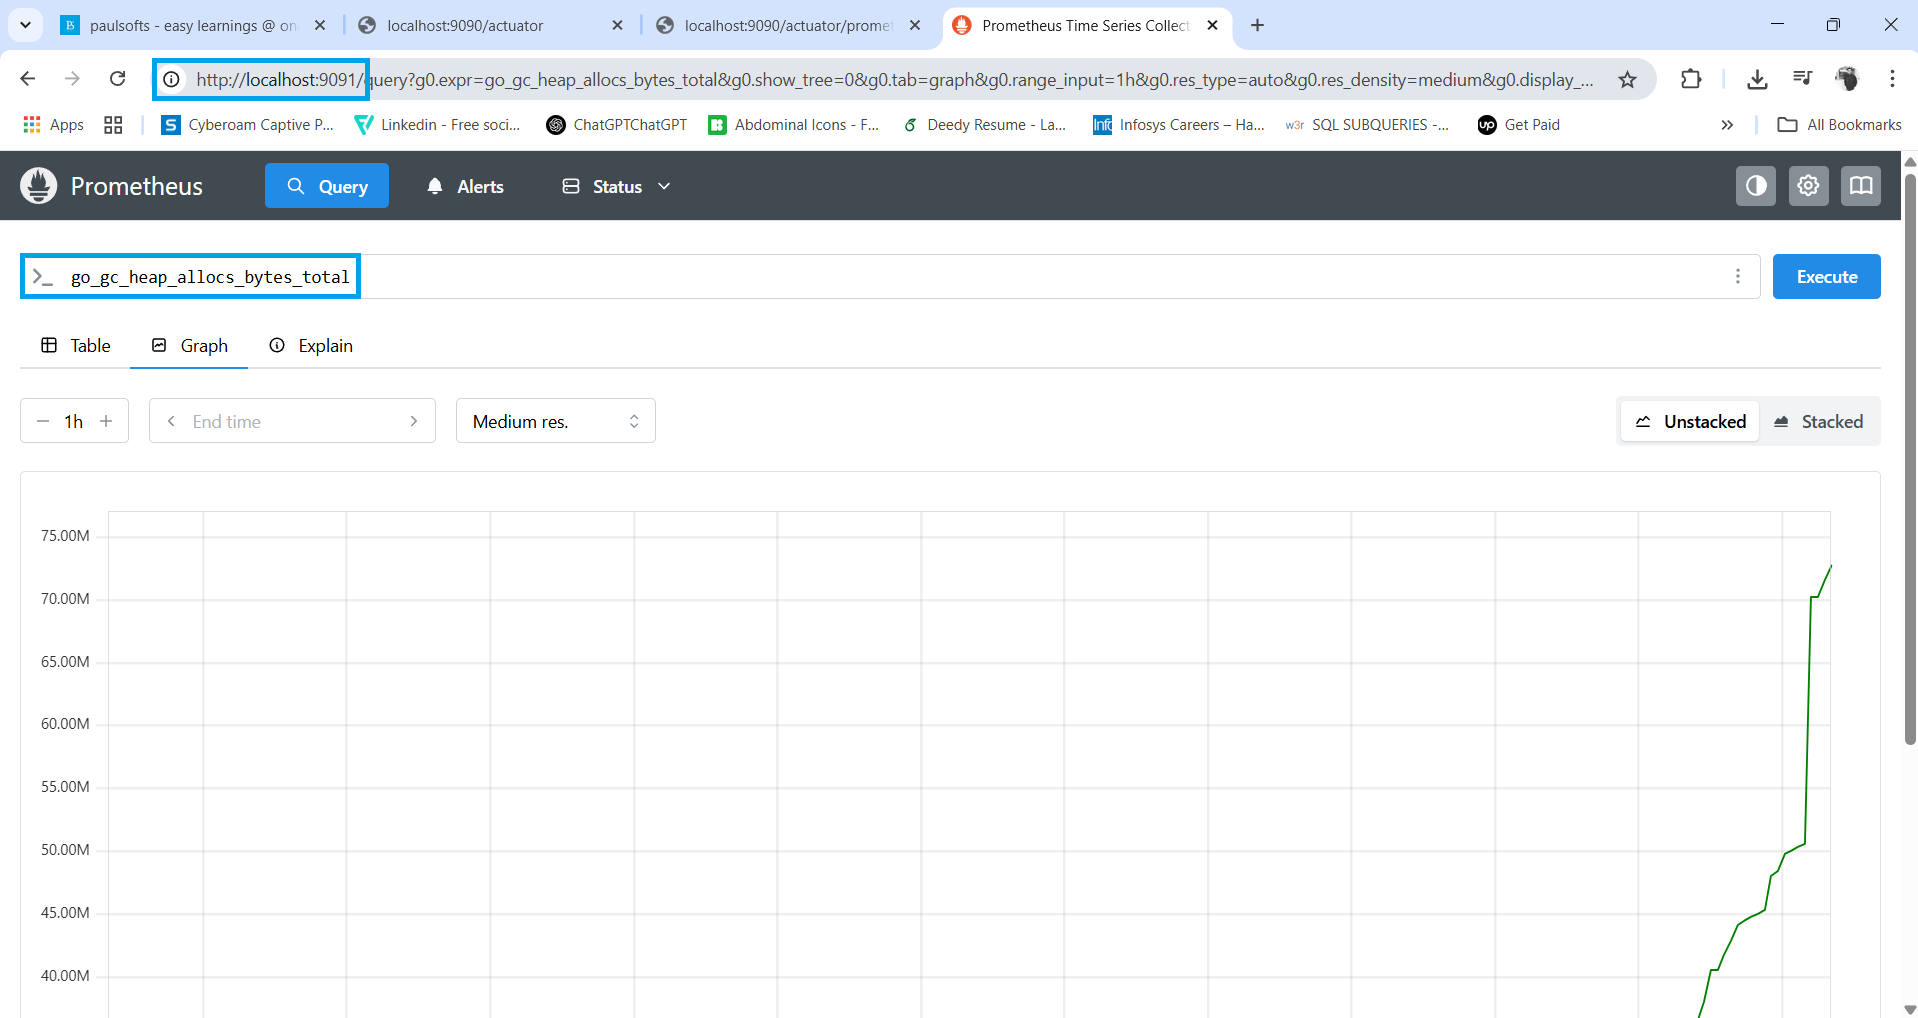
Step 4: How to run Prometheus query
Once Prometheus is running, you can access the Prometheus web UI at http://localhost:9091. In the dashboard’s “Expression” (query) input field, start typing a metric name—Prometheus will auto-suggest available metrics collected from your application.
You can explore and run PromQL queries to monitor various system and application-level metrics, such as memory usage, HTTP request counts, and response times. The dashboard offers powerful filtering and visualization options to help you understand your application’s performance in real time.